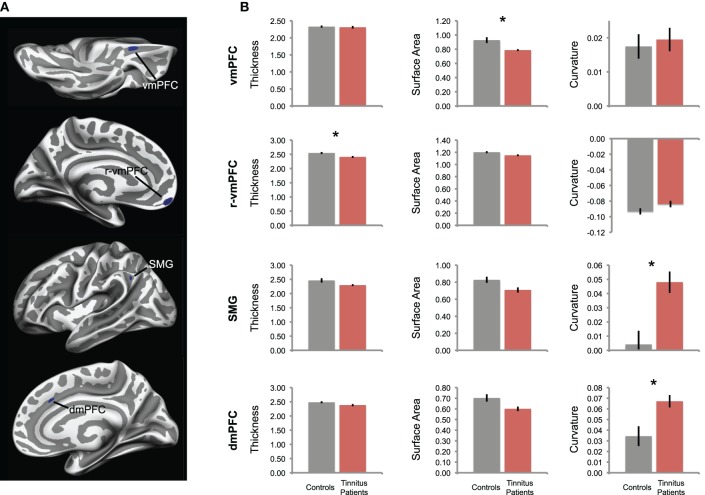
Figure 3.
Differences in cortical morphology in tinnitus, in a surface-based analysis. (A) Tinnitus-related reductions in GM volume are confirmed in a single-vertex analysis across the entire cortical surface. Tinnitus patients had significantly smaller GM volumes in the same areas identified in the volume-based analysis shown in Figure 1, vmPFC, dmPFC, and SMG, as well as an additional cluster in rostral vmPFC (r-vmPFC). (B) For each cluster in (A), the mean values of morphological features are plotted, including cortical thickness, surface area, and gyrification (curvature) for each group. For gyrification, positive values indicate sulci, negative values indicate gyri. Tinnitus patients are plotted in red; control participants are plotted in gray. Error bars represent standard error, and asterisks denote significant difference between groups (pcorr < 0.05).

