
Figure 3.
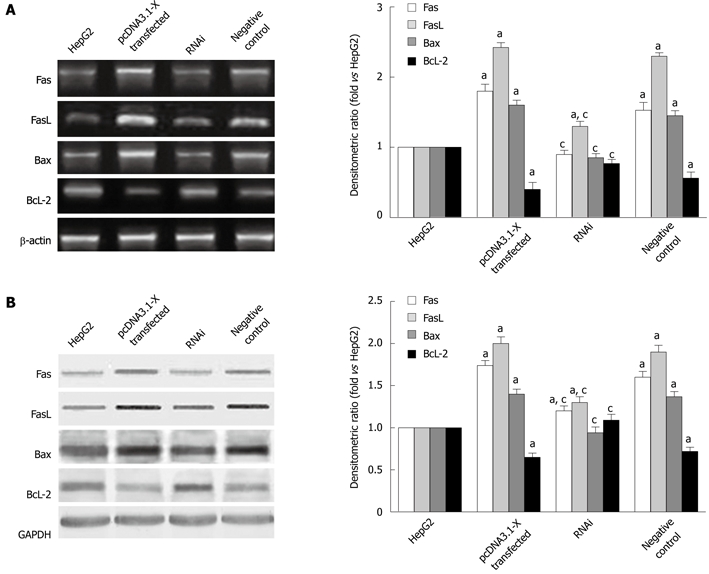
Expression of Fas, FasL, Bax, Bcl-2 mRNA and protein in HepG2 cells induced by hepatitis B virus X protein. Transfection of HepG2 cells is described in Figure 2. Forty-eight hours after transfection, the mRNA (A) and protein (B) expression levels of Bax, Bcl-2, Fas and FasL were determined by RT-PCR and Western blotting analysis. Data are expressed as mean ± SD (n = 3), aP < 0.05 vs the HepG2 group; cP < 0.05 vs pcDNA3.1-X transfected group and negative control group.