
Figure 5.
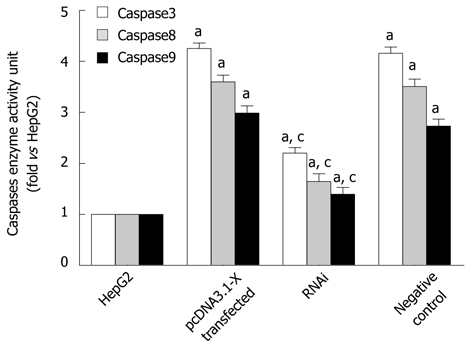
Detection of activated caspases in HepG2 cells transfected with hepatitis B virus X protein. Transfection of HepG2 cells is described in Figure 2. Forty-eight hours after transfection, the enzyme activity of caspase3, caspase8 and caspase9 was analyzed by spectrophotometric test. Data are expressed as mean ± SD (n = 3), aP < 0.05 vs the HepG2 group; cP < 0.05 vs pcDNA3.1-X transfected group and negative control group.