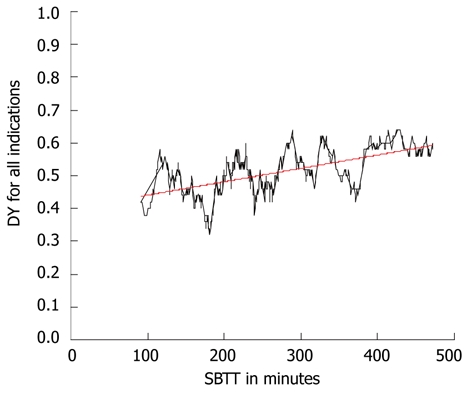
Figure 1.

Correlation between the small bowel transit time in minutes and the diagnostic yield for all patients. Spearman’s rho coefficient 0.58 ( P < 0.01) shown by the black line. The trend of this correlation is shown by the red line. DY: Diagnostic yield; SBTT: Small bowel transit time.
