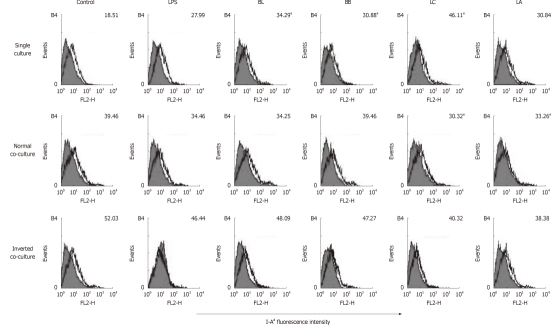
Figure 2.
Effect of probiotics on I-Ad of single- or co-cultured dendritic cells. Fluorescence activated cell sorter analysis of probiotics-treated dendritic cells (DC) cultured in the presence or absence of intestinal monolayers for 12 h. Filled histograms are isotype controls; unfilled histogram show staining for I-Ad. Numbers indicate the mean fluorescent intensity of three representative experiments. aSignificant difference among the control, lipopolysaccharides and probiotics as determined by analysis of variance (P < 0.05). LPS: Lipopolysaccharides; BL: Bifidobacterium lactis AD011, BB: Bifidobacterium bifidum BGN4, LC: Lactobacillus casei IBS041; LA: Lactobacillus acidophilus AD031.

