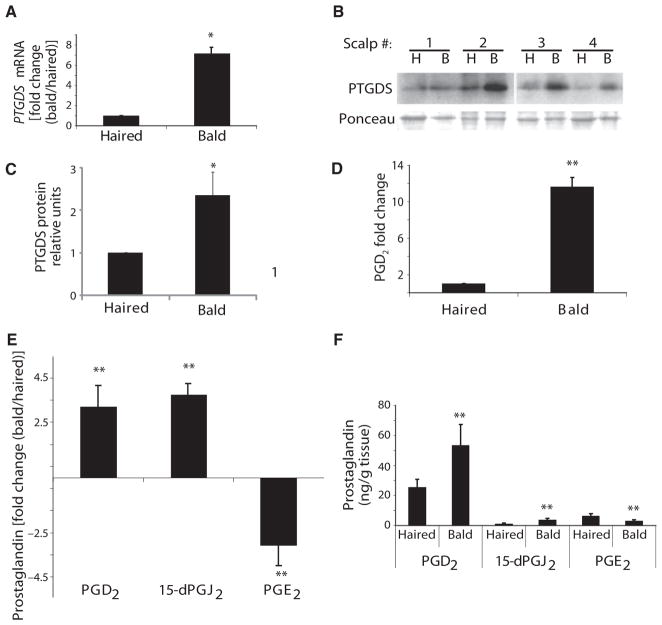
Fig. 2.
Increased PGD2 pathway activity in balding scalp of men with AGA. (A) Expression of lipocalin-type PTGDS mRNA in bald versus haired scalp, as tested by qPCR. Data are means ± SEM (n = 4). (B and C) The amount of PTGDS protein in paired bald (B) and haired (H) scalps (n = 4), as shown by Western blotting with Ponceau stain used for verification of equal loading (B) and its quantitation as normalized to haired scalp (C). Data are means ± SEM. (D) PGD2 production in bald scalp, as tested by ELISA. Data are means ± SEM (n = 3). (E and F) Fold change in PGD2 (n = 17), 15-dPGJ2) (n = 7), and PGE2 (n = 17) expression in bald scalp compared to haired scalp (E). Total prostaglandin content is quantified in (F). Data are means ± SEM. *P < 0.05; **P < 0.01. In (F), P value compares haired versus bald samples for each prostaglandin.

