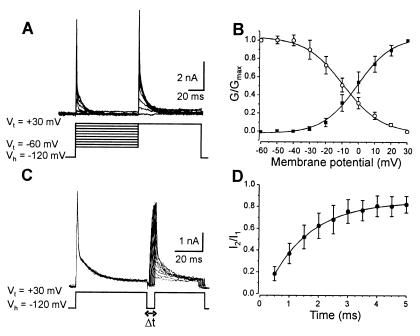
Figure 2.
Activation, inactivation, and recovery from inactivation of IA current. (A) A double test voltage step was applied in the control and in catechol (100 μM), the first to Vt between −60 and +30 mV and the second to +30 mV. IA current was isolated by subtracting the current evoked in catechol from that evoked in control. (B) The activation curve (■) was fitted with the best-fitting Boltzmann equation: G/Gmax = (1 + e(V − V1/2)/k)−1. The steady-state inactivation curve (○) was determined by plotting the mean normalized conductance as a function of the membrane potential. (C) A two-voltage-step protocol to +30 mV applied at increasing intervals was used to determine the recovery from inactivation of the IA current. The traces shown correspond to the current blocked by catechol. (D) The recovery from the inactivation curve corresponds to the mean normalized IA current amplitude as a function of the interpulse duration.

