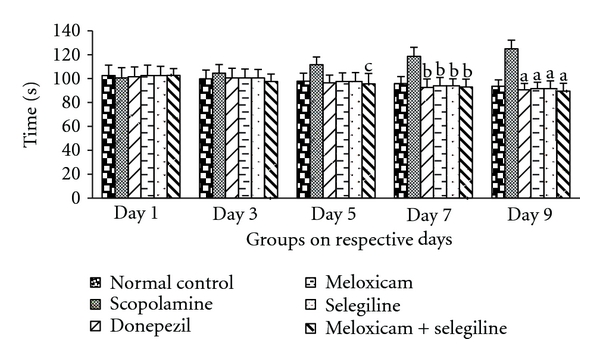
Figure 1.

Rectangular maze test. Effect of meloxicam and selegiline on latency time compared to the disease control group. (Mean ± SD, n = 6). Graph showing mean ± SD of latency time in seconds. a P < 0.001, b P < 0.01, c P < 0.05 compared with corresponding values of disease control.
