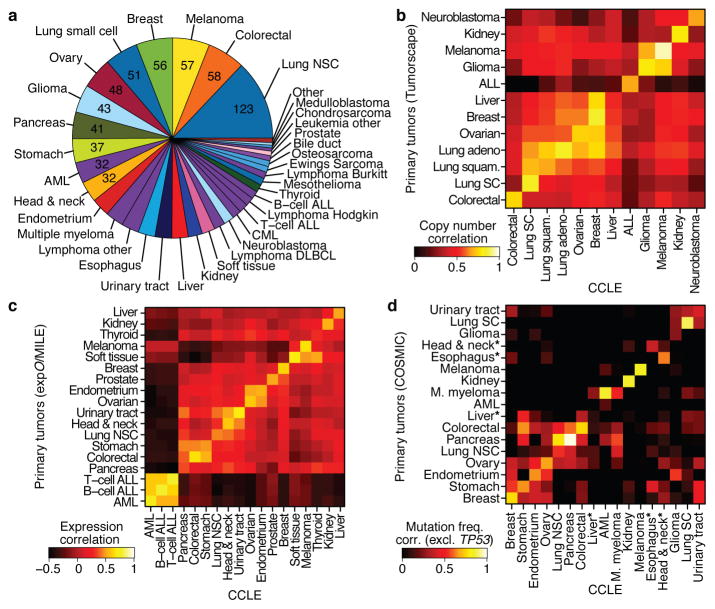
Figure 1. The Cancer Cell Line Encyclopedia (CCLE).
a. Distribution of cancer types in the CCLE by lineage. b. Comparison of DNA copy-number profiles (GISTIC G-scores) between cell lines and primary tumors. The diagonal of the heatmap shows the Pearson correlation between corresponding sample types. Because cell lines and tumors are separate datasets, the correlation matrix is asymmetric: the top left showing how well the tumor features correlate with the average of the cell lines in a lineage, and the bottom right showing the converse. c. Comparison of mRNA expression profiles between cell lines and primary tumors. For each tumor type, the log-fold-change of the 5,000 most variable genes is calculated between that tumor type and all others. Pearson correlations between tumor type fold-changes from primary tumors and cell lines are shown as a heatmap. d. Comparison of point mutation frequencies between cell lines and primary tumors in COSMIC (v56), restricted to genes that are well represented in both sample sets but excluding TP53 which is highly prevalent in most tumor types. Pairwise Pearson correlations are shown as a heatmap. *The correlations of esophageal, liver, and head and neck cancer mutation frequencies are restored when including TP53.

