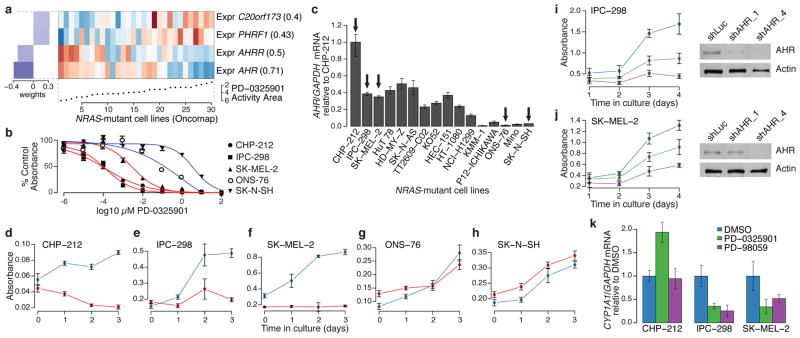
Figure 3. AHR expression may denote a tumor dependency targeted by MEK inhibitors in NRAS-mutant cell lines.
a. Predictive features for PD-0325901 sensitivity (varying baseline activity area) in validated NRAS-mutant cell lines. b. Growth inhibition curves for NRAS-mutant cell lines expressing high (red) or low (blue) levels of AHR mRNA in the presence of the MEK inhibitor PD-0325901. c. Relative AHR mRNA expression across a panel of NRAS-mutant cell lines (arrows indicate cell lines where AHR dependency was analyzed). d–h. Proliferation of NRAS-mutant cell lines displaying high (d–f) and low (g–h) AHR mRNA expression, after introduction of shRNAs against AHR (red lines) or luciferase (blue lines). i. (left) Proliferation of IPC-298 cells (high AHR) after introduction of additional shRNAs against AHR (shAHR_1 and shAHR_4; green and purple lines, respectively) or luciferase (control shLuc; blue line); (right) corresponding immunoblot analysis of AHR protein. j. Equivalent studies as in (i) with using SK-MEL-2 cells (high AHR). k. Endogenous CYP1A1 mRNA expression in the neuroblastoma line CHP-212 or the melanoma lines IPC-298 and SK-MEL-2 after exposure to vehicle (blue) or MEK inhibitors (PD-0325901, green or PD-98059, purple). Error bars: standard deviation between replicates, with n=12 (b), n=3 (c), n=6 (d–k).

