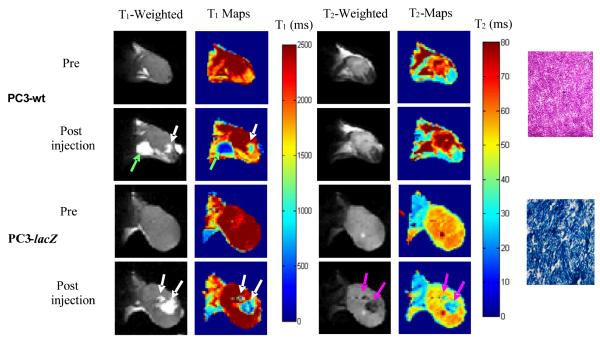
Figure 6. Imaging β-gal activity in vivo.
In vivo study showing lacZ gene-reporter activity detected by 1H MRI in representative PC3 tumor xenografts in SCID mice after intra-tumoral injection (100 μl total volume) of ferric ammonium citrate (FAC) and 13. The presence of FAC + 13 is seen in T1-weighted images (TR/TE = 300/12 ms) and T1 maps (white arrows) in both wild type tumors (columns 1 and 2, row 2) and lacZ tumors (columns 1 and 2, row 4). Baseline tumor T1 = 2.8± 0.1 s for lacZ and 2.6± 0.2 s for WT, versus 1.1± 0.6 s for lacZ and 1.8 ± 0.5 s for WT following injection of 13 + FAC. Significant change in T2-weighted images (TR/TE = 6000/50 ms, column 3, row 4) and T2 values (column 4, row 4) was seen only in the lacZ-transfected tumors post injection of FAC and 13 (pink arrows). Baseline T2 = 56 ± 4 ms for lacZ and T2 = 63 ± 7 ms for WT, became T2 = 34 ± 10 ms for lacZ and T2 = 63 ± 18 ms for WT. Green arrow indicates anomalous injection outside tumor, and this region was excluded from analysis. Histological sections at right (original magnification × 100) confirm intense β-gal expression in –lacZ tumor based on X-gal and H&E staining (blue, lower slide) with essentially no activity in WT tumor (pink, upper slide).

