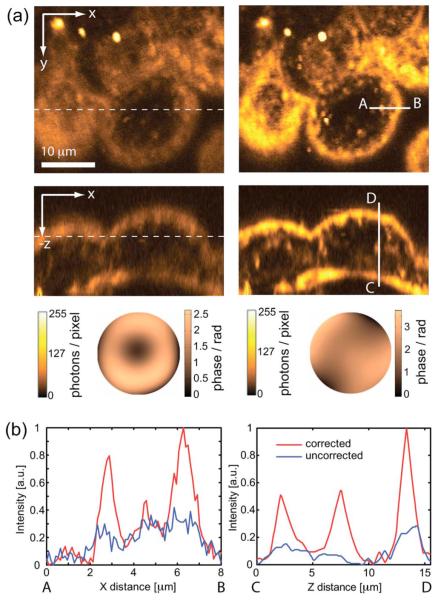
Fig. 3.
(Color online) (a) THG images of a 5.5 day old live mouse embryo with correction of only system aberrations (left) and after additional correction of specimen-induced aberrations (right). The dashed lines show where the xy and xz planes intersect. The corresponding correction phase functions are also shown. (b) Intensity profiles along the solid lines A-B and C-D as drawn in (a).

