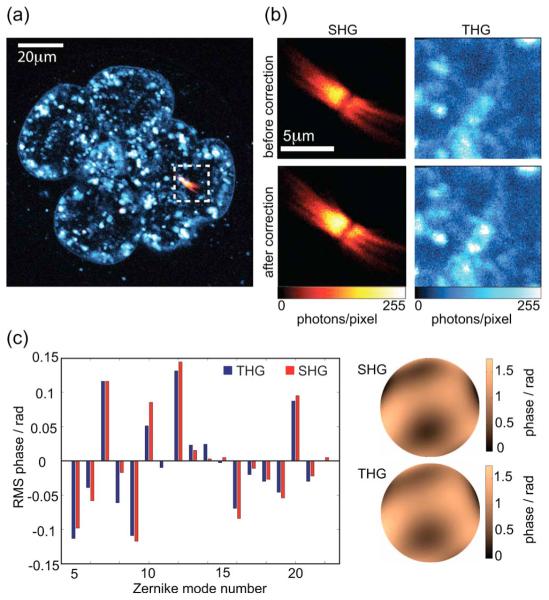
Fig. 4.
(Color online) Equivalence of correction using SHG and THG signals. (a) Overview of the 2.5 day old embryo showing SHG (solid red) and THG. (b) Sections used for the SHG- and THG-based corrections. The sections are located in close vicinity. Upper image pair, before correction; lower image pair, after correction. (c) Zernike coefficients and phase functions retrieved by both correction procedures.

