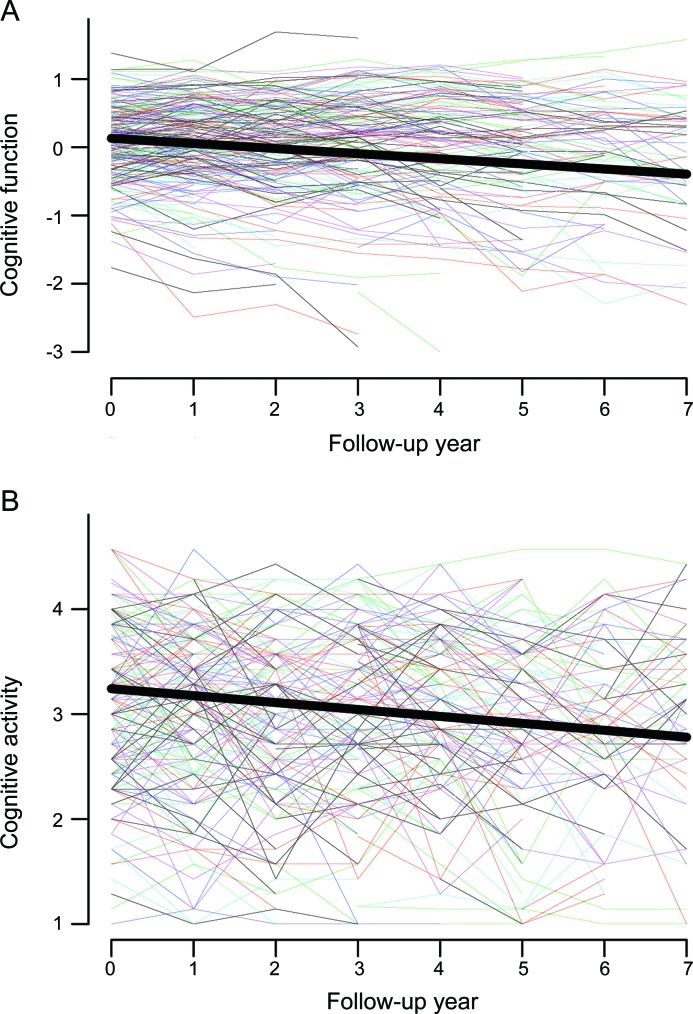
Figure 2. Change in cognitive function and cognitive activity.
Crude paths of change in global cognitive function (A) and cognitive activity (B) for a random sample of 200 participants (colored lines) and the predicted paths for a typical participant (black line), adjusted for age, sex, and education.

