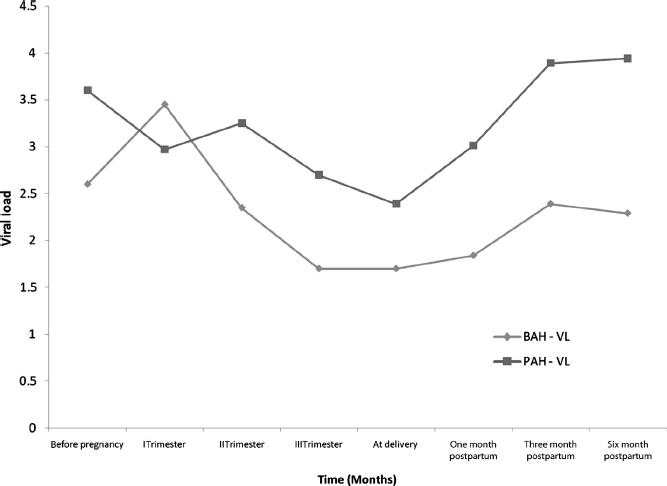
Figure 2.

Longitudinal virologie assessment of PAH and BA groups before, during, and after pregnancy. Median values of log10 HIV RNA copies/mL are depicted on the Y axis and time in months on the X axis. Diamonds and squares represent the BAH and PAH groups, respectively.
