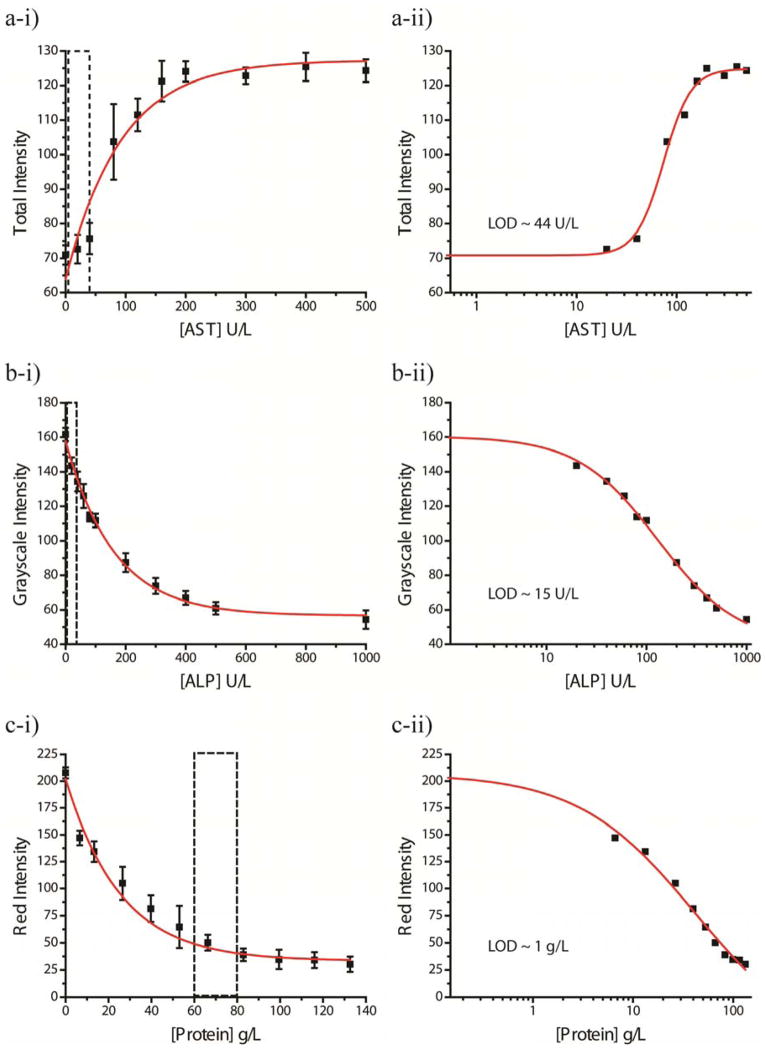
Figure 4.
Calibration (left) and Limit of Detection (LOD) Curves (right) for a) AST, b) ALP, and c) Protein. The boxes outlined in dotted lines on the calibration curves indicate the normal range for each analyte. The total color intensity analyzed at 20 minutes for each concentration generated the AST calibration curve. Grayscale intensity analyzed at 30 minutes for each concentration generated the ALP calibration. Red intensity analyzed at 30 minutes for each concentration generated the Protein Calibration. The limits of detection were determined to be ~44 U/L, ~15 U/L, ~1 g/L for AST, ALP, and Protein, respectively.

