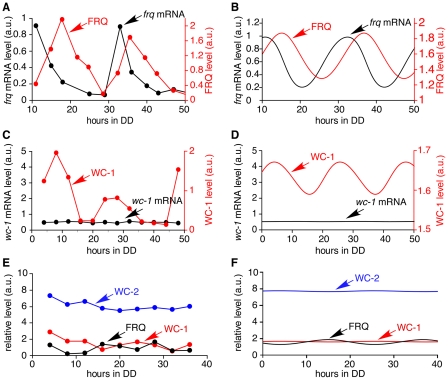
Figure 3. Continuous dark simulations.
(A) Experimental data showing the oscillation of frq mRNA and FRQ protein levels [41]. The period length is approximately 22 hours, and FRQ (red line) peaks 3–7 hours after frq mRNA (black line). (B) Simulated results showing the oscillation of frq mRNA and FRQ protein levels has a period of 21.6 hours, and FRQ peaks 4.4 hours after frq mRNA. Simulation begins 10 hours after a light to dark transfer, 10 data points per hour. (C) Experimental data showing wc-1 mRNA and WC-1 protein levels [42]. The level of wc-1 mRNA is nearly constant. WC-1 protein expression oscillates. (D) Simulated results. wc-1 mRNA (black line) level is constant and WC-1 oscillates. Simulation begins at the light to dark transfer, 10 data points per hour. (E) The level of WC-2 protein is 5–30 times higher than the average level of FRQ and WC-1 protein [43]. (F) In the model WC-2 protein is 10 times higher than the average level of FRQ and WC-1 proteins. Simulation begins at the light to dark transfer, 10 data points per hour are plotted.

