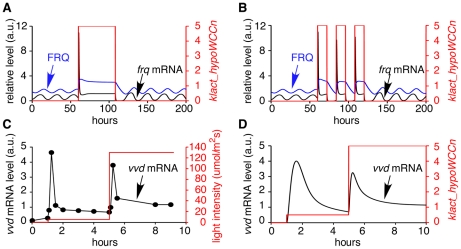
Figure 6. Simulated results of light resetting, entrainment by light/dark (LD) cycles, and photoadaptation.
(A) The simulation consists of 60 h dark, 48 h constant light, 92 h constant dark. 10 data points per hour are plotted. The red line indicates light intensity. After the dark to light transfer, frq mRNA and FRQ protein increase and the oscillation is lost. Rhythmic expression begins without delay on return to darkness. (B) The simulation began with continuous dark for 60 hours, followed by three cycles of 12 h light: 12 h dark, before transfer to constant dark. The simulated clock can be entrained to 24 h with 12 h: 12 h light: dark cycles. (C) Experimental data shows the molecular behaviour of photoadaptation [25]. Light intensity (red line) of 5 mol·m−2·s−1 for 4 hours and 130 mol·m−2·s−1 for 5 h. vvd mRNA level (black line) is rapidly and transiently induced to high levels immediately after exposure to light. (D) The behaviour of vvd mRNA photoadaptation is reproduced in the model. A second increase in light intensity results in a rapid increase of vvd RNA. The levels soon fall but remain at a higher level compared to levels at the lower light intensity. 100 data points per hour were plotted.

