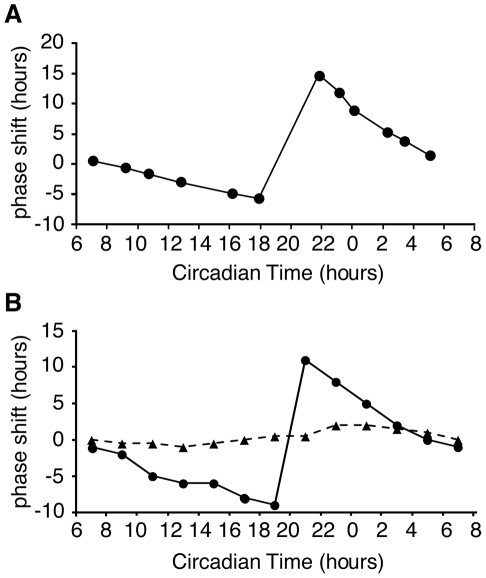
Figure 7. Phase response curves.
(A) Plot of experimental data showing light-induced phase shifts [45]. Light pulses given during the late subjective night and early morning result in large phase shifts. (B) Light-induced phase shifts are reproduced in the model. 0.1 h light pulses (solid line) cause larger phase shifts than 0.01 h light pulses (dashed line). Large phase shifts occurred during the late subjective night and early morning. 20 and 200 data points/h were plotted for simulated 0.1 and 0.01 h light pulse respectively.

