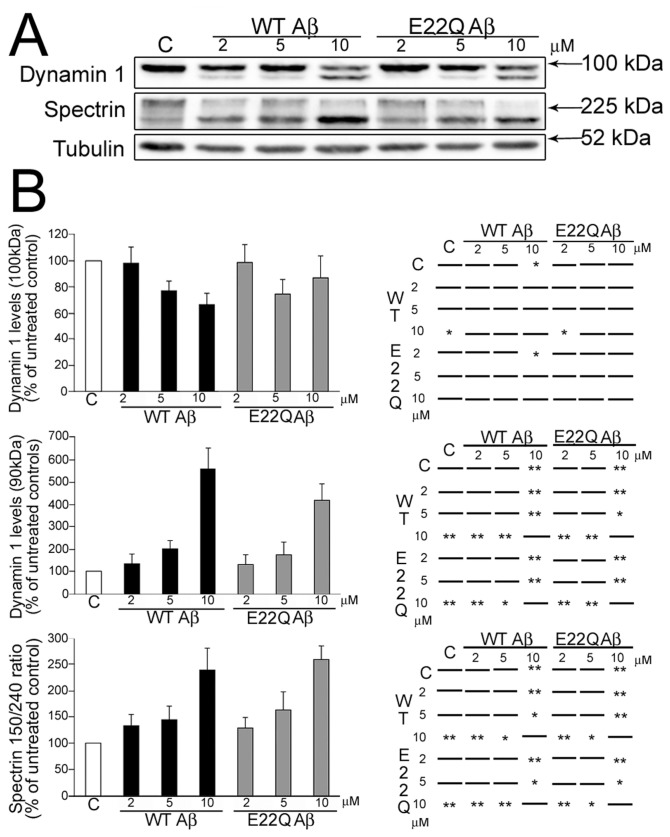
Figure 2.
E22Q Aβ–induced dynamin 1 cleavage in mature hippocampal neurons. (A) Western blot analysis of whole cell extracts prepared from 21 d in culture hippocampal neurons incubated in the absence (C ) or presence of increasing concentrations of WT or Dutch (E22Q) Aβ and reacted with dynamin 1 and spectrin antibodies. Strong immunoreactive cleaved dynamin 1 (~90 kDa) bands were detected in either WT or E22Q Aβ–treated neurons. Tubulin was used as a loading control. (B) Graphs on the left show the levels of full-length (~100 kDa) and cleaved (~90 kDa) dynamin 1 bands, and the spectrin 150/240-kDa ratio in control and WT or Dutch Aβ–treated hippocampal neurons. Values are expressed as the percentage of untreated controls, considering the values obtained in these neurons as 100%. Each number represents the mean ± SEM from five different experiments. Charts on the right show the statistical significance of the differences among all experimental conditions calculated by one-way ANOVA followed by Fisher LSD post hoc test. *Differs from control, P < 0.05; **differs from control, P < 0.01.

