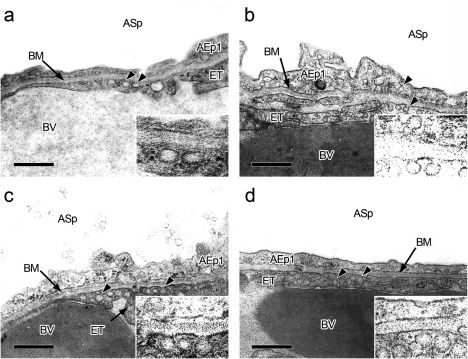
Fig. 5.
Representative transmission electron microphotographs of vesicles (arrowheads) in the lungs from the control (a) and the small-sized FITC-PLGA nanoparticle groups at 5 minutes (b), 30 minutes (c), and 60 minutes (d) after treatment (inserts: higher magnification of the vesicles). AEp1: type-I alveolar epithelial cell; ASp: alveolar space; BM: basement membrane; BV: blood vessel; ET: endothelial cell. Bars = 500 nm.

