
Figure 2.
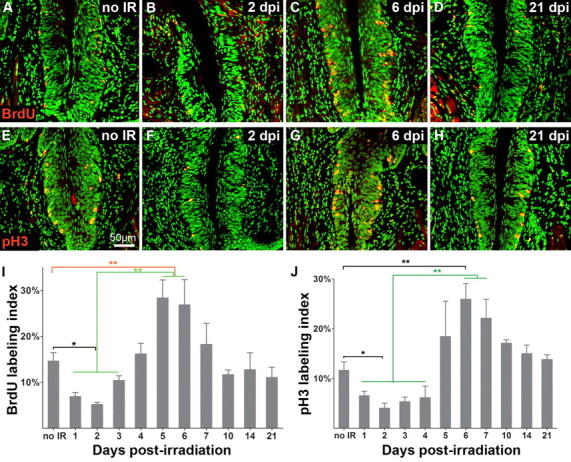
The proportions of cells in S and M phase drop following irradiation, then overshoot control levels, before returning to normal values. Cells in S phase in controls and at selected times postirradiation are identified via nuclear incorporation of BrdU (A–D; BrdU-IR, red) and those in M phase are immunoreactive for pH3 (E–H; pH3-IR, red). A–D, Sham-irradiated controls, 2, 6, and 21 dpi. E–H, Sham-irradiated controls, 2, 6, and 21 dpi. Histograms for S (I) and M (J) phase show labeling indices of sham-irradiated epithelium versus that of epithelium harvested at progressive times postirradiation. The proportion of basal cells in both S and M phases are significantly decreased at 2 dpi. Significantly more basal cells are in S phase at 5–6 dpi compared with controls; the proportion in M phase also overshoots controls at 6 dpi (G, J). Both indices are comparable to controls from 7 dpi onward. One-way ANOVA, Tukey's post hoc test; n = 3–4 mice for each time point; *p < 0.05; **p < 0.01.