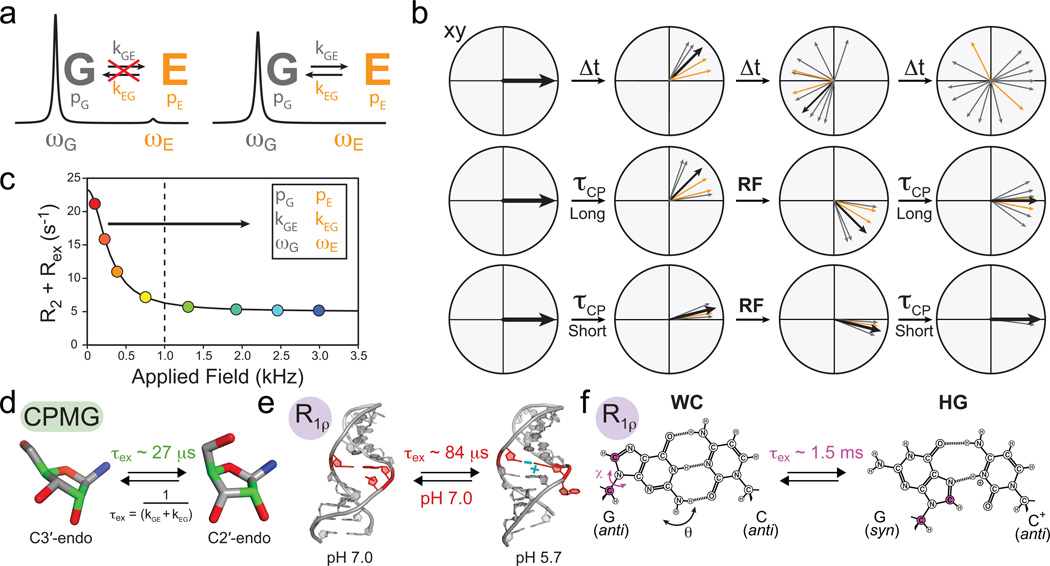
Figure 4.
Characterizing micro- to millisecond exchange by relaxation dispersion. (a) Exchange between ground (G) and excited (E) states leads to broadening of the G signal and disappearance of the E signal. (b) Fanning out of bulk magnetization due to exchange can be suppressed by application of RF fields. (c) Characteristic relaxation dispersion curve showing the power dependence of Rex which can be used to extract in favorable cases the populations (p), exchange rates (k) and chemical shifts (ω) of G and E. (d–f) Examples of conformational exchange characterized by CPMG and R1ρ carbon relaxation dispersion. (d) Sugar repuckering in a GCAA tetraloop using selectively labeled C2' and C4' (green) probes61. (e) Transition toward an excited state structure in the U6 RNA involving a CA+ base-pair and looping out of a uridine bulge68. (f) Transition to Hoogsteen (HG) GC+ base-pairs in canonical duplex DNA (Adapted from ref. 70).

