Figure 1.
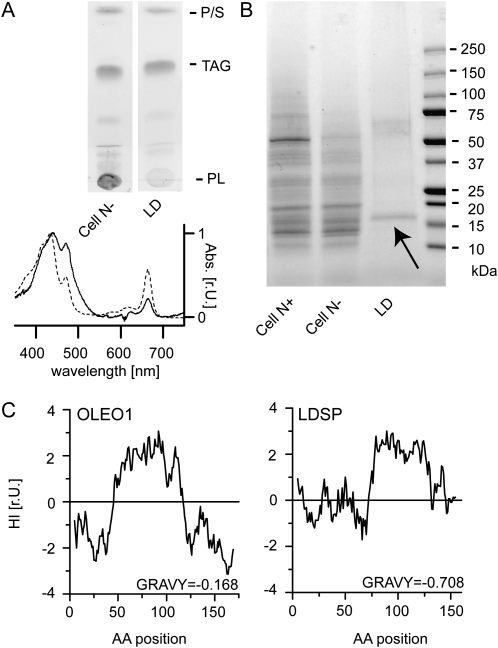
LDSP is the predominant protein in LD Fractions. A, Thin layer chromatogram of nonpolar lipids showing TAG enrichment in N-deprived cells (cell N-) and LD fractions (top); 10 μg fatty acid was loaded per lane. P, Pigments; S, sterols; PL, polar lipids. Absorption spectrum of cell N- (dashed line) and LD fractions (solid line) showing enrichment of carotenoids by increased absorption in the blue light and depletion of chlorophyll. B, Coomassie blue-stained SDS-PAGE gel of Nannochloropsis total protein in the N-replete state (Cell N+), after 40 h of N deprivation (Cell N-), and the LD fraction (LD). Arrow indicates 17-kD protein submitted to mass spectrometry. C, Kyte-Doolittle hydropathy index (HI) with window size of 9; r.U., relative units.

