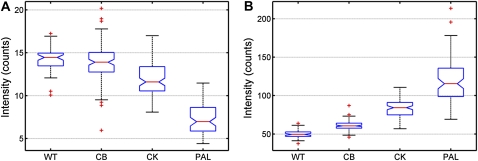
Figure 5.
Statistical box plots of the mean intensities for PSI (A) and PSII (B) from all cells for each cell type. The red center line represents the median of these values, and the 95% confidence band is denoted by notches. The bottom and top of the box represent the 25th and 75th percentiles, respectively. The dotted extended lines indicate ±2.7σ (99.3% data coverage), and the red crosses represent statistical outliers. n = 332 cells. WT, Wild type. [See online article for color version of this figure.]

