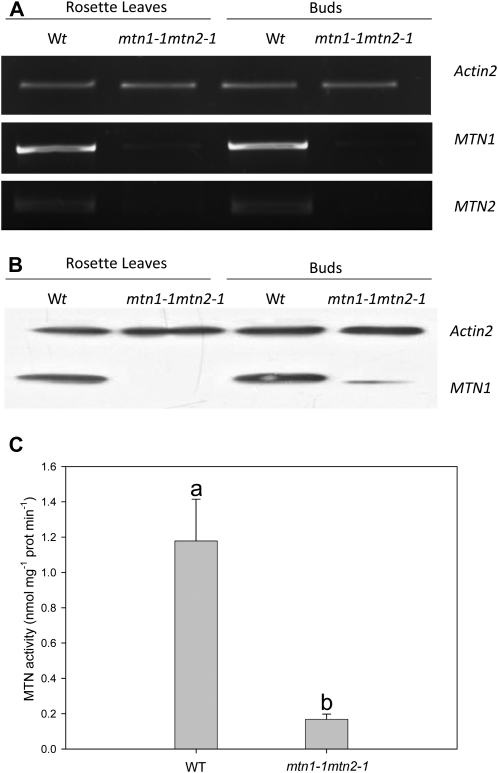
Figure 2.
MTN transcript and protein abundance with corresponding enzyme activity. Results are averages ± sd of three to 10 independent biological replicates. A, RT-PCR showed that MTN1 and MTN2 transcript abundance was reduced in mtn1-1mtn2-1. Actin was used as the reference gene to ensure equal loading of the cDNA (n = 3). B, Immunoblot analysis indicated that MTN1 was present in buds and leaves of wild-type plants. In mtn1-1mtn2-1, MTN1 was considerably lower in buds and undetectable in leaves. Detection of actin protein confirmed equal protein loading (n = 3). C, Specific enzyme activity of MTN1 was measured in buds harvested from plants 2 weeks after bolting. Statistically significant variables are indicated by different letters (P < 0.05; n = 10). Wt/WT, Wild type.

