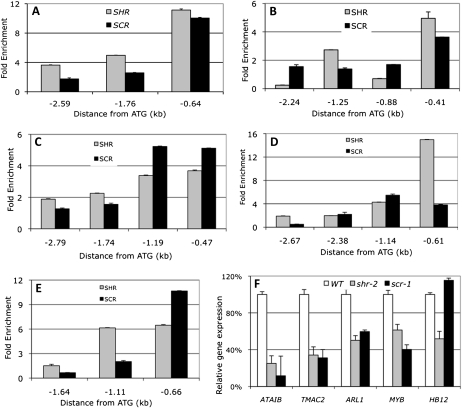
Figure 1.
SHR and SCR directly control stress response genes. A to E, ChIP-PCR assay showing binding of SHR and SCR to the promoters of ATAIB (A), TMAC2 (B), ATHB12 (C), At1g68670, a MYB transcription factor (D), and ARL1 (At1g24120; E). The x axis indicates the distance (kb) from the translation start site. F, Real-time RT-PCR assay showing the transcript level for the above genes in wild-type (WT), shr-2, and scr-1 root. Error bars represent sd from technical replicates. Note the different y axis scales.

