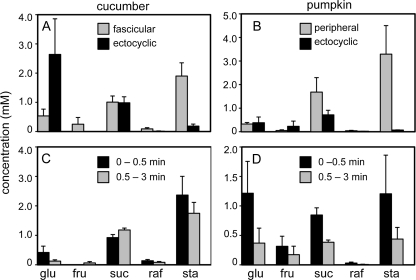
Figure 7.
Exudate sugar concentrations. Sugar concentrations are shown in cucumber (A and C) and pumpkin (B and D). In A and B, ice water was applied to the soil, and 10 min later, the stem was cut. After rapid blotting, exudate was collected from different phloem types. Data are from approximately 100 cuts per plant (n = 3 plants). In C and D, ice water was not applied to the soil. The stems were cut, and exudate from all phloem types was sampled together. Data are from three to five cuts per plant (n = 3 plants).

