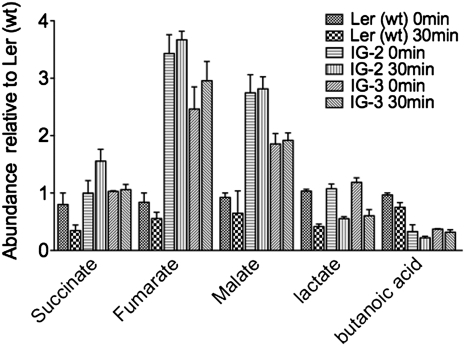
Figure 6.
Quantification of small organic acids present in the CaCl2 extracts of Ler (wt), IG-2, and IG-3 cell cultures before and after elicitation. Ler (wt), IG-2, and IG-3 cell cultures were elicited with purified cell wall extract from F. oxysporum. After elicitation, the cell cultures were filtered and then incubated for 30 min in 200 mm CaCl2. The supernatant was then recovered, derivatized with ECF or BSTFA, and analyzed by GC-MS, as described in “Materials and Methods.” Data represent averages ± sd of the normalization against Ler (wt).

