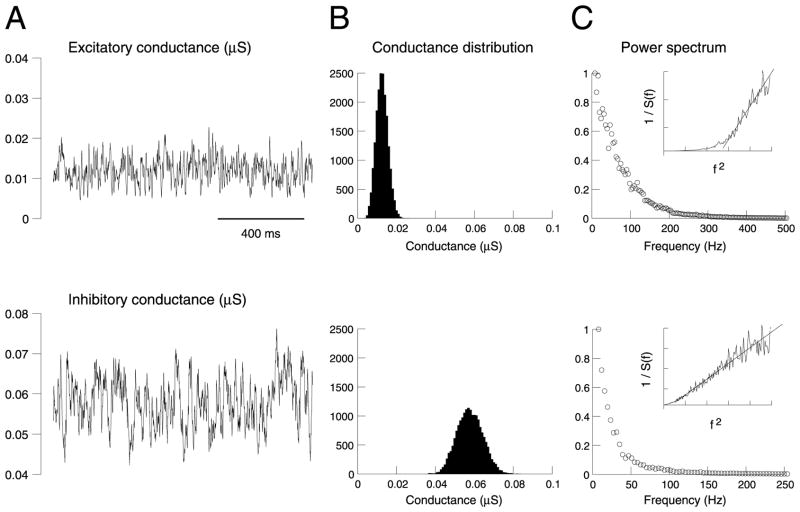
Fig. 2.
Statistical properties of the conductances underlying background activity in the detailed biophysical model. (A) Time course of the total excitatory (top) and inhibitory (bottom) conductances during synaptic background activity. (B) Distribution of values for each conductance, calculated from A. (C) Power spectral density of each conductance. The insets show the inverse of the power spectral density (1/S(f)) represented against squared frequency (f2 ; same scale used).

