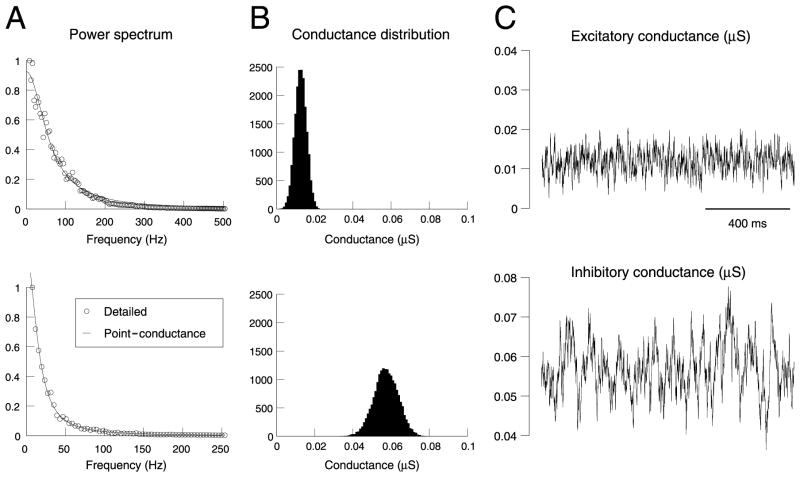
Fig. 3.
Fit of a point-conductance model of background synaptic activity. (A) Power spectral density of the conductances from the biophysical model (top = excitatory, bottom = inhibitory). The continuous lines show the best fits obtained with the stochastic point-conductance model. (B) Distribution of conductance values for the point-conductance model. (C) Time course of the excitatory and inhibitory conductances of the best stochastic model. The same data lengths as in Fig. 2 were used for all analyses.

