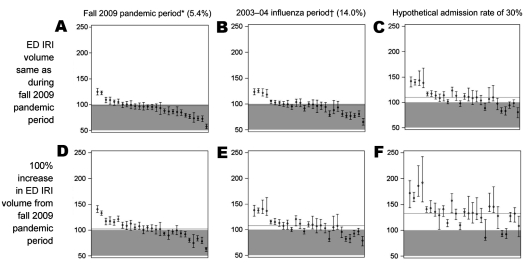
Figure.
Predictive model of hospital occupancy during 11-week outbreak of pandemic influenza A (H1N1) 2009 in the United States, by ED IRI admission rate and ED IRI volume, using fall 2009 pandemic period data as baseline. Percentages given indicate hospital admission rate during period or for hypothetical scenario. Gray area indicates 100% occupancy. Each circle represents median occupancy from 1 hospital; vertical whiskers indicate interquartile range. y-axes indicate percentage occupancy; x-axes indicates individual hospitals. Median (interquartile range) occupancy across study hospitals: A) 95.9% (85.0%–100.3%); B) 97.9% (80.5%–102.7%); C) 109.7% (97.9%–117.1%); D) 102.2% (91.7%–112.4%); E) 108.0% (96.4%–114.9%); F) 132.4% (124.5%–145.5%). Letters correspond to scenarios in Table 3. *MMWR reporting weeks 35–45 (September 5–November 20, 2009). †MMWR reporting weeks 44–53 (November 1, 2003–January 9, 2004). ED, emergency department; IRI, influenza-related illness; MMWR, Morbidity and Mortality Weekly Report (Centers for Disease Control and Prevention, Atlanta, GA, USA).

