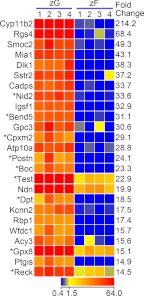
Fig. 3.
Heat map representation of microarray analysis for the 25 transcripts with the highest differential expression in zG vs. zF. Arbitrary signal intensity acquired from microarray analysis is represented by color (see color bar). Fold change was calculated as average of normalized zG signal intensities divided by that of normalized zF signal intensities. Predicted transcripts are indicated by an asterisk.

