
Fig. 4.
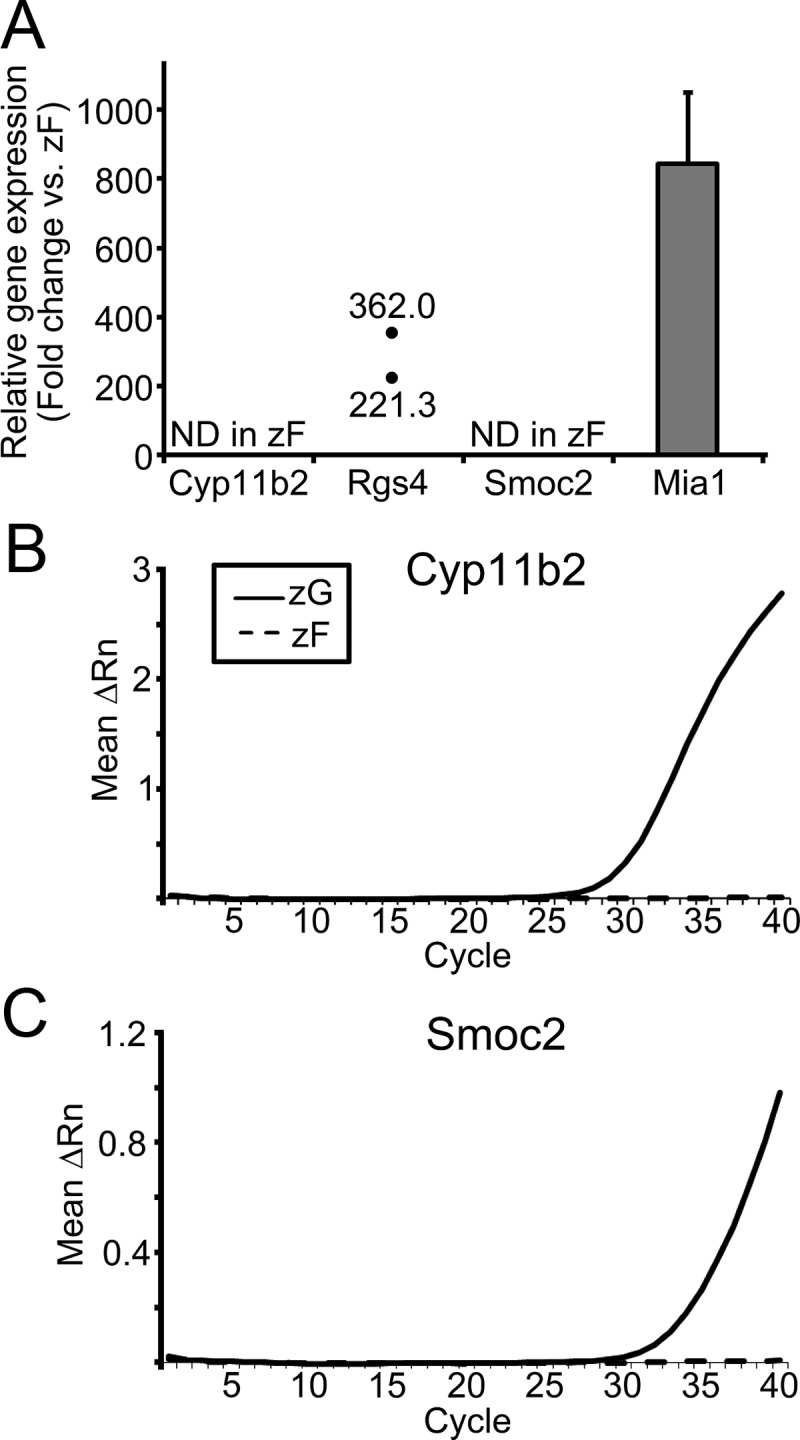
qPCR analysis for the transcripts with the highest differential expression in zG vs. zF. A, Fold change in each transcript. Cyp11b2 and Smoc2 were not detectable (ND) in all (rats 1–4) zF samples, preventing calculation of their fold differences. Rgs4 was detectable only in two zF samples (rats 2 and 3); therefore, the fold changes of the transcript were calculated from two pairs of zG/zF data. Results are shown as mean ± sem based on four independent experiments with duplicate wells in each experiment. B and C, qPCR curves illustrating mean ΔRn against PCR cycle number for transcripts of ND in zF (Cyp11b2 and Smoc2). ΔRn represents the normalized reporter signal (Rn) minus the baseline signal.