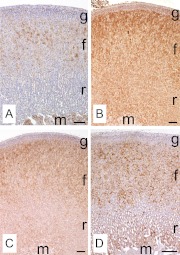
Fig. 8.
Immunohistochemistry for highly up-regulated transcripts in zF. Each panel shows a representative image of immunohistochemistry for DDAH1 (A), CIDEA (B), FRZB (C), and 11βHSD2 (D). These figures show clear histological zonation of zG (g), zF (f), zR (r), and medulla (m) according to nuclear staining using hematoxylin. Scale bar, 100 μm.

