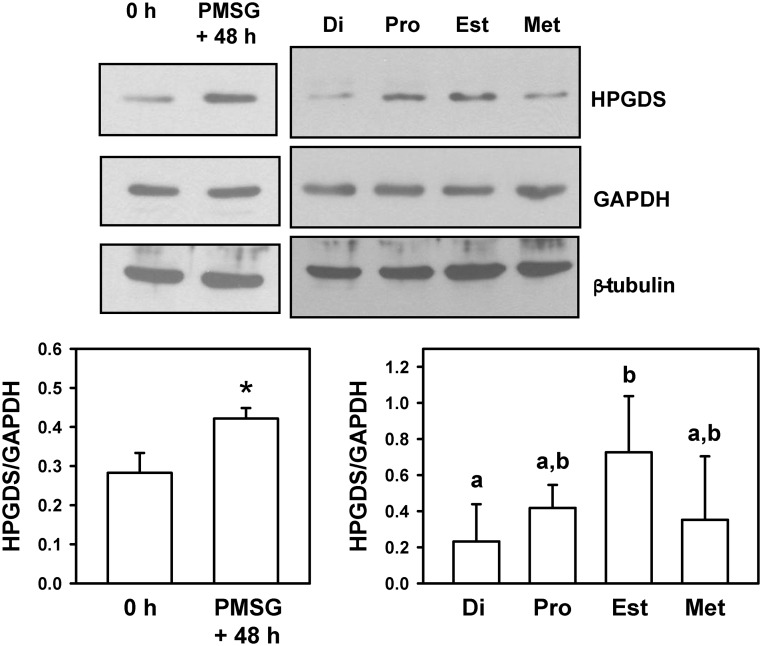
Fig. 2.
Detection of HPGDS in whole oviducts of mice. Upper panels, Images of representative Western blottings are shown. Upper left, Immature mice were killed at 23 d of age (0 h) or treated with 5 IU of PMSG to induce follicular development and killed 48 h later. Upper right, Eight- to ten-week-old regularly cycling mice were killed on each day of the estrous cycle. Di, Diestrus; Pro, proestrus; Est, estrus; Met, metestrus. GAPDH and β-tubulin were used as loading controls. Lower panels, Quantification of Western blottings (HPGDS/GAPDH). Lower left, An asterisk indicates differences in gene expression (P < 0.01). Lower right, Values with different superscript letters differ (P < 0.05).

