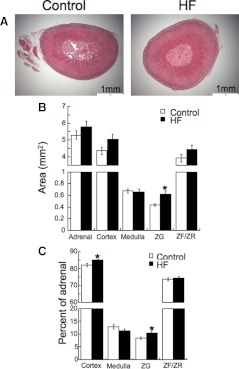
Fig. 3.
Rats fed a HF diet exhibit ZG hypertrophy. A, Representative slices of adrenal glands from rats fed the HF and control diets. B, Areas of the individual regions of the adrenal. C, Those regions expressed as a percentage of the adrenal area (n = 7 for controls and 8 for the HF; * indicates a significant difference from control).

