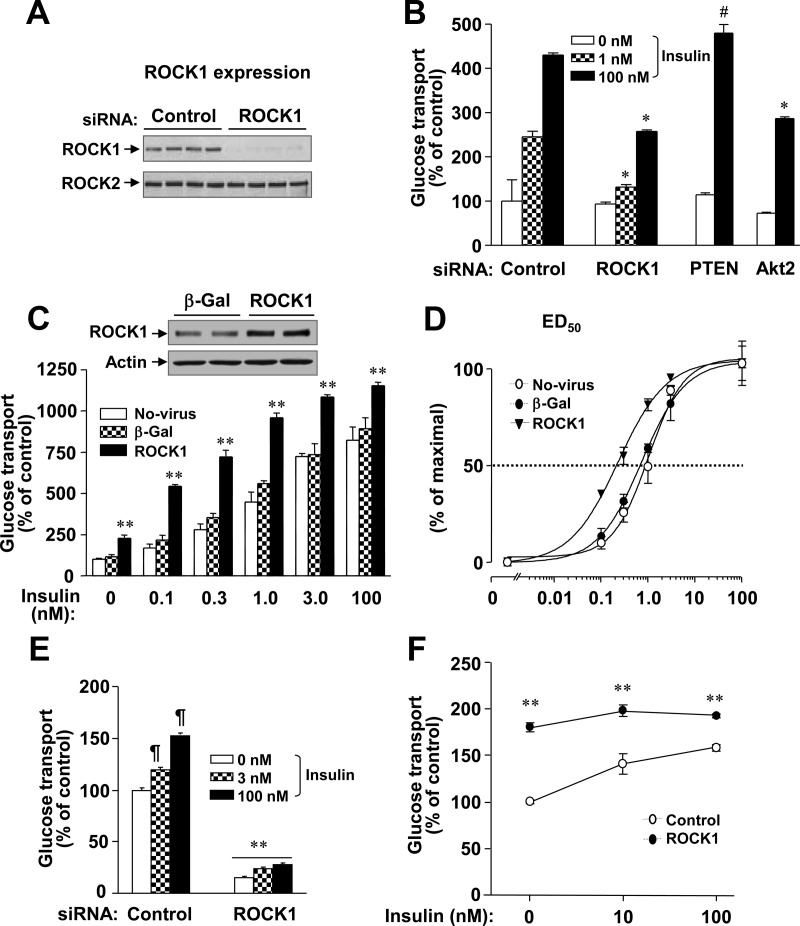
Fig. 1.
ROCK1 regulates glucose transport in 3T3-L1 adipocytes and L6 myoblasts. A, The expression levels of ROCK1 and ROCK2 in 3T3-L1 adipocytes. Cells were transfected with ROCK1 siRNA or luciferase (control) siRNA. ROCK were visualized by immunoblotting with a polyclonal ROCK1 or ROCK2 antibody. B, Effects of ROCK1 inhibition on glucose transport in 3T3-L1 adipocytes. Cells were serum starved and then stimulated with insulin (0, 10, or 100 nm) for 30 min. As control experiments, cells were also transfected with Akt2 siRNA or PTEN siRNA. [3H]-2-deoxy-D-glucose uptake was measured and the results are expressed as a percentage of basal glucose transport in control cells. Data are means ± sem; #, P < 0.05; *, P < 0.01 vs. the corresponding condition with control. C, Effects of ROCK1 overexpression on glucose transport in 3T3-L1 adipocytes. Cells were transduced with recombinant adenovirus encoding β-Gal or ROCK1 as described in Materials and Methods. ROCK1 was visualized by immunoblotting with a polyclonal ROCK1 antibody. Cells were serum starved and then stimulated with insulin, as indicated, for 30 min. [3H]-2-deoxy-D-glucose uptake was measured, and the results are expressed as a percentage of basal glucose transport in control cells. Data are means ± sem; **, P < 0.001 vs. the corresponding condition with β-Gal or no-virus. D, Effects of ROCK1 on dose response of glucose transport in 3T3-L1 adipocytes. ED50 for glucose uptake was calculated from the data of C. E, Effects of ROCK1 inhibition on glucose transport in L6 myoblasts. Cells were transfected with ROCK1 siRNA, serum starved, and then stimulated with insulin (3 or 100 nm) for 30 min. [3H]-2-deoxy-D-glucose uptake was measured, and the results are expressed as a percentage of basal glucose transport in control cells. Data are means ± sem; ¶, P < 0.01 vs. basal condition in control cells; **, P < 0.001 vs. the corresponding condition with control siRNA. F, Effects of ROCK1 overexpression on glucose transport in L6 myoblasts. Cells were transfected with ROCK1 cDNA or control cDNA. Cells were serum starved and then incubated without and with insulin (100 nm) for 30 min. [3H]-2-deoxy-D-glucose uptake was measured, and the results are expressed as a percentage of basal glucose transport in control cells. Data are means ± sem; **, P < 0.01 vs. the corresponding condition of the control. All data are representative of three independent experiments.

