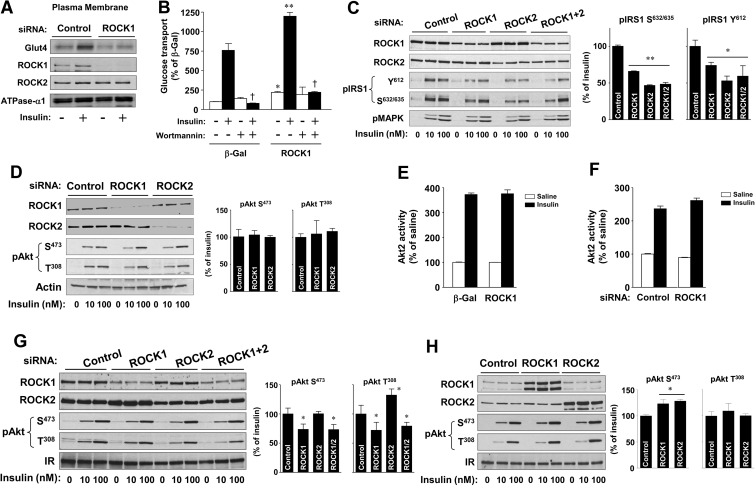
Fig. 2.
Regulation of insulin signaling by ROCK isoforms in 3T3-L1 adipocytes and L6 myoblasts. A, Effects of ROCK1 on insulin-dependent Glut4 translocation in 3T3-L1 adipocytes. Cells were transfected with ROCK1 siRNA or luciferase (control) siRNA. Cells were serum starved and then stimulated with insulin (100 nm) for 30 min. The PM fraction was harvested as described in Materials and Methods. Glut4, ROCK1, ROCK2, and N+,K+-APTase α1 were visualized by immunoblotting with indicated antibodies. B, Effects of wortmannin on ROCK1-mediated glucose transport in 3T3-L1 adipocytes. Cells were transduced with recombinant adenovirus encoding β-Gal or ROCK1 as described in Materials and Methods. Cells were pretreated with a PI3K inhibitor wortmannin (50 nm) or with a vehicle for 30 min and then stimulated with insulin (100 nm) for 30 min. [3H]-2-deoxy-D-glucose uptake was measured, and the results are expressed as a percentage of basal glucose transport in control cells. Data are means ± sem and representative of three independent experiments. +, P < 0.001 vs. insulin-stimulated condition within same group; *, P < 0.01; **, P < 0.001 vs. the corresponding condition with β-Gal. C and D, Effects of ROCK isoforms on insulin signaling in 3T3-L1 adipocytes. Cells were transfected with ROCK1, ROCK2, or luciferase (control) siRNA. Cells were serum starved and then stimulated with insulin (10 or100 nm) for 15 min. The bands for insulin signaling molecules were visualized by immunoblotting with phospho-specific antibodies or total antibodies as indicated. The bands were quantitated using densitometry. Data are means ± sem and representative of three independent experiments. *, P < 0.05; **, P < 0.01 vs. control siRNA. E and F, Effects of ROCK1 on Akt2 activity in 3T3-L1 adipocytes. E, Cells were transduced with recombinant adenovirus encoding β-Gal or ROCK1. F, Cells were transfected with ROCK1 or luciferase siRNA (control). Cells were serum starved and then stimulated with insulin (100 nm) for 20 min. Akt2 activity was measured and represented compared with control in the basal condition. Data are means ± sem. G, Effects of ROCK inhibition on insulin signaling in L6 myoblasts. Cells were transfected with ROCK1, ROCK2, or luciferase (control) siRNA. Cells were serum starved and then stimulated with insulin (10 or 100 nm) for 15 min. The bands for insulin signaling molecules were visualized by immunoblotting with phospho-specific antibodies or total antibodies as indicated. The Akt bands were quantitated using densitometry. Data are means ± sem and representative of three independent experiments. *, P < 0.05 vs. control siRNA. H, Effects of ROCK overexpression on insulin signaling in L6 myoblasts. Cells were transfected with ROCK1 cDNA or control cDNA. Cells were serum starved and then stimulated with insulin (10 or100 nm) for 15 min. The bands for insulin signaling molecules were visualized by immunoblotting with phospho-specific antibodies or total antibodies as indicated. The Akt bands were quantitated using densitometry. Data are means ± sem and representative of three independent experiments. *, P < 0.05 vs. control.

