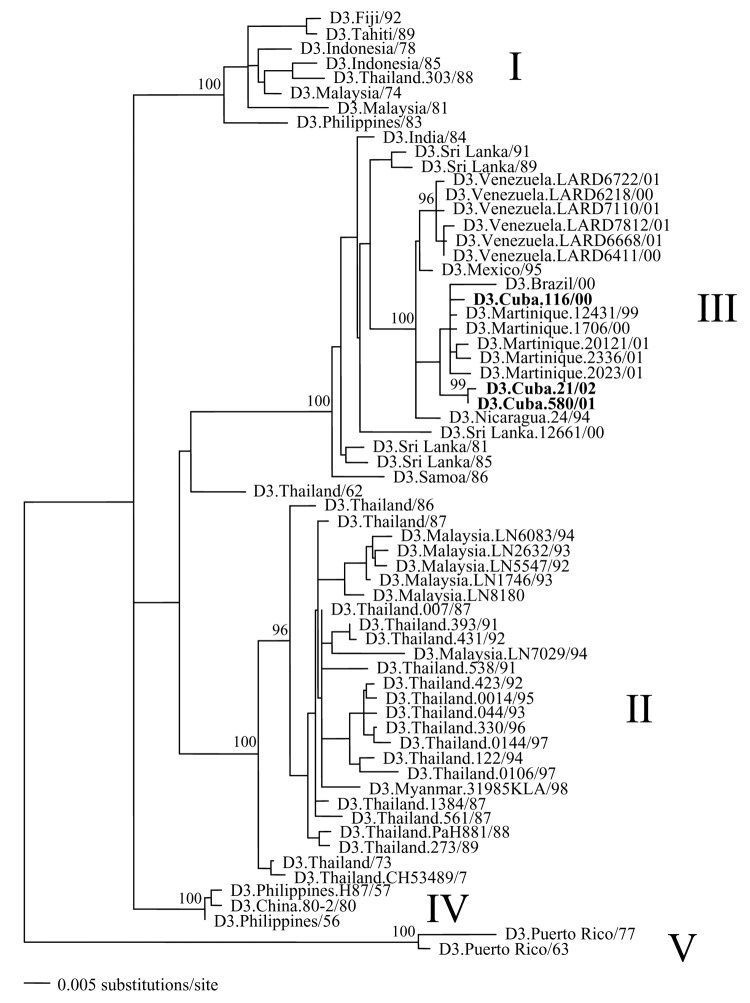
Figure.
Maximum likelihood (ML) phylogenetic tree showing the evolutionary relationships among the E gene sequences of 64 strains of DENV-3. All branch lengths are drawn to scale, and tree was rooted using strains from the Puerto Rico 1960s epidemic, which always appear as the most divergent. Bootstrap support values are shown for key nodes only; the Cuban isolates are designated by bold type. See Table A1 for GenBank accession numbers of the other DENV-3 strains used in this analysis.

