Figure.
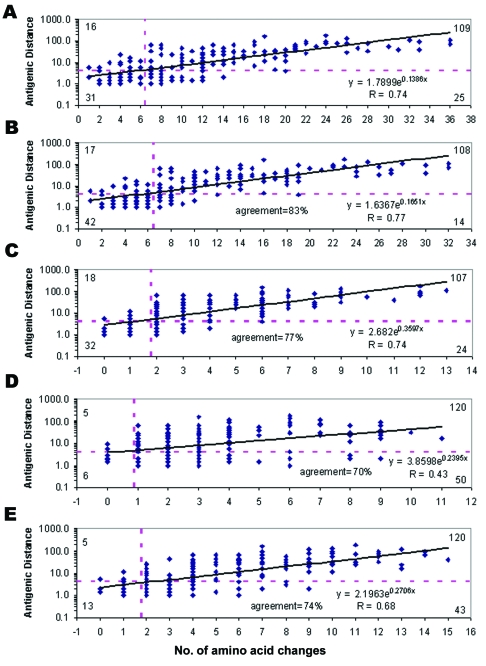
Performance of the five prediction models. Solid line at each plot, regression; horizontal dashed line, cutoff of antigenic distance >4; vertical dashed line, cutoff of number of amino acid changes. Numbers at the four corners indicate true negative (lower left), false negative (upper left), true positive (upper right), false positive (lower right) in each prediction model. A) The first model was based on amino acid differences in the whole HA1 polypeptide (329 residues). B) The second model was based on amino acid differences in the five antigenic sites (131 residues). C) The third model was based on the 20 positions related to mouse monoclonal antibody binding. D) The fourth model was based on the 18 positions under positive selection. E) The fifth model was based on the 32 codons with substantial diversity.

