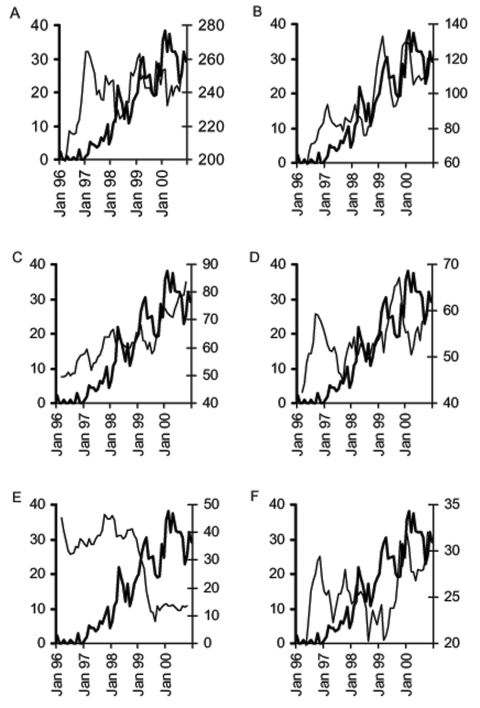
Figure 2.
Examples of graphic exploration of the relationship between the monthly % methicillin-resistant Staphylococcus aureus (%MRSA) and the monthly use of individual classes of antimicrobials, Aberdeen Royal Infirmary, January 1996–December 2000 (THICK LINE, %MRSA; THIN LINE, Antimicrobial use, 5-month moving average, right Y-axis); A) penicillins with β-lactamase inhibitors, B) macrolides, C) third-generation cephalosporins, D) fluoroquinolones, E) tetracyclines, and F) aminoglycosides.

