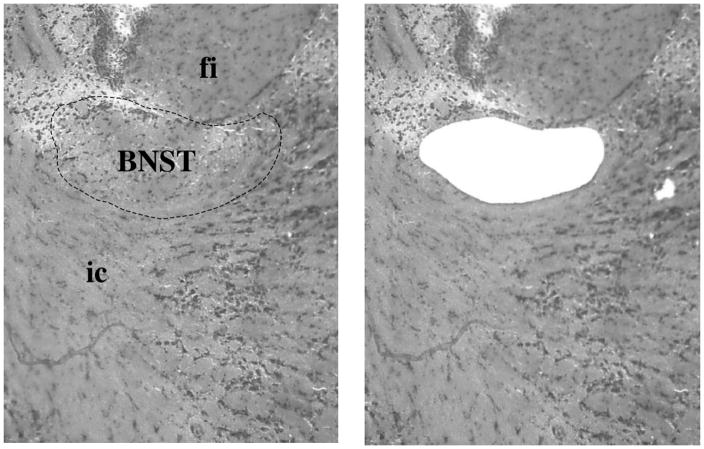
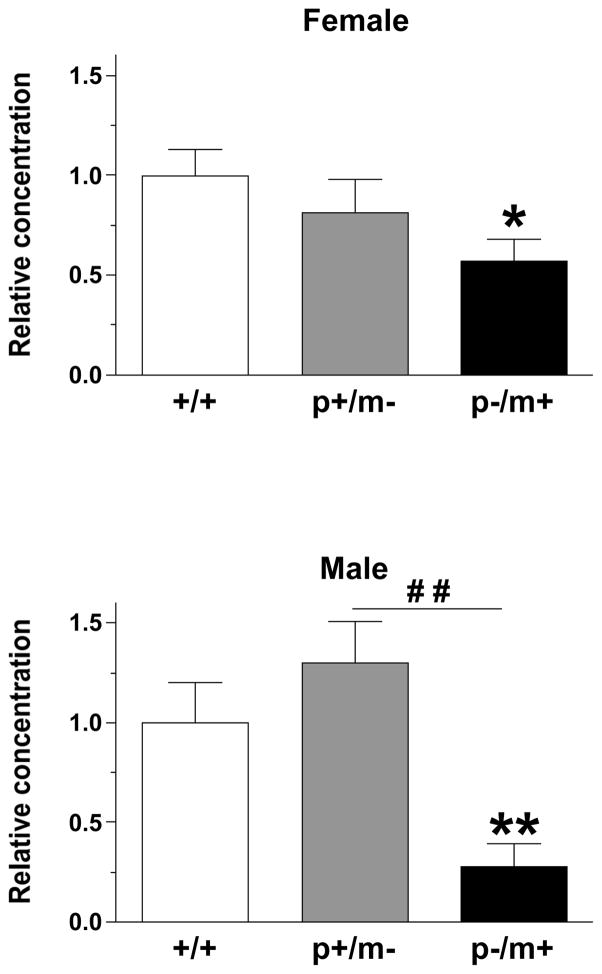
Figure 7.
A) Representative example of the bed nucleus of the stria terminalis, supracapsular part (BNST) (bregma −1.22, 10X magnification, outlined by dashed line) that was removed by laser capture microdissection. For reference the fimbria of the hippocampus (fi) and the internal capsule (ic) have been labeled. B) Histograms depicting the expression level of Gabrb3 (mean ± SEM) in the BNST, relative to expression in gender-matched controls (n=5–7 per genotype). *p<0.05, **p<0.01 indicates significant differences from controls, whereas ##p<0.01 represents significant differences between male p+/m− and p−/m+ mice.


