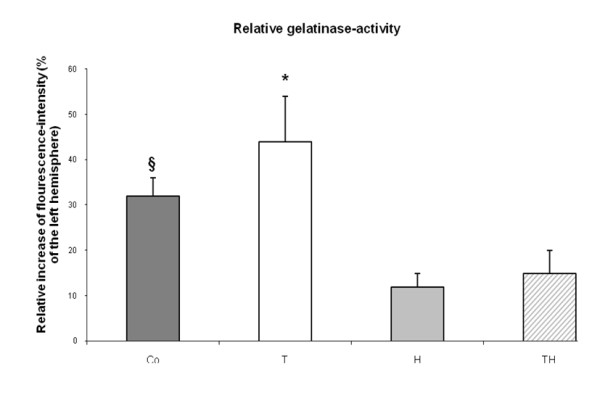
Figure 6.

Relative gelatinase-activity is shown as a percentage of the left, non-ischemic hemisphere and expressed as mean ± SD. Highest activity could be observed in group T which is significantly higher compared to group Co (p < 0.05) and the groups H and TH (p < 0.01) as indicated by the asterisks. The fluorescence intensity is significantly higher in group Co compared to group H and Th (p < 0.05) as indicated by the string sign.
