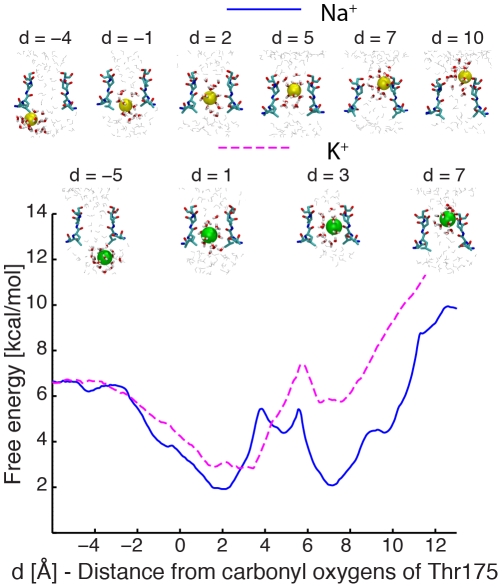
Figure 2. Potential of Mean force for conduction events with one Na+ ion and one K+ ion.
Values on the x-axis correspond to the distance between the permeating ion and the centre of the carbonyl oxygen atoms of residues Thr175 along the pore axis. The free-energy for a permeating Na+ ion is shown in a blue continuous line and K+ in a pink dashed line. Snapshots from the umbrella sampling trajectories are shown for some significant configurations. Residues 175 to 178 of two opposite subunits are depicted in licorice representation, together with the permeating ion in VDW spheres, yellow and green for Na+ and K+. Water molecules closer than 5 Å (licorice representation) and 15 Å (grey lines) from the ion are also shown.

