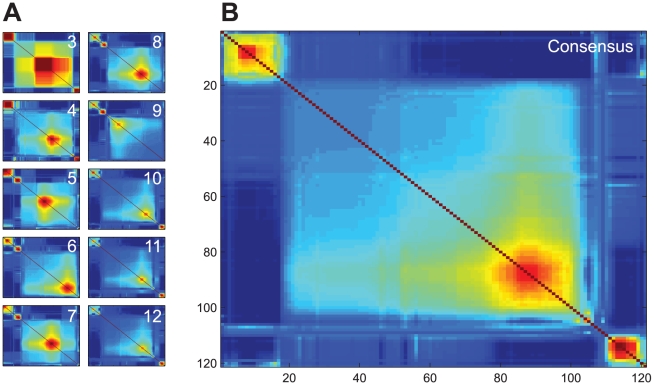
Figure 3. Co-occurrence matrices.
A) Average over ten restarts of the co-occurrence matrices for clustering with a fixed number of clusters. Number of clusters K is indicated in each plot. Matrices were ordered for visualization using optimal leaf ordering. B) Consensus co-occurrence matrix obtained by averaging the individual co-occurrence matrices presented in A. Order of perturbations in the consensus matrix is given in Table S2. Red color denotes high co-occurrence, and blue low co-occurrence.

