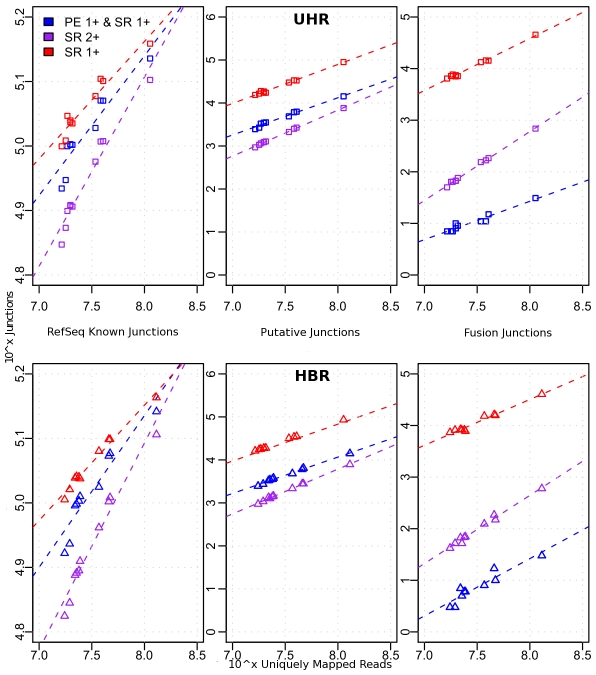
Figure 2. Combined evidence improves specificity of splice and fusion detection.
Scatterplots show the increasing mapped coverage (x-axis) versus Left: Known RefSeq junctions; Middle: Putative junctions; Right: Fusion junctions. Top track shows results for UHR and bottom track for HBR. Three different evidence thresholds were compared: 1) red line: one SPAN (SR) evidence required for junction call, 2) magenta line: two SPAN (2-SR) evidences required for junction call, and 3) blue line: one SPAN and one BRIDGE evidence (1-SR-1-PE) required for junction call.

