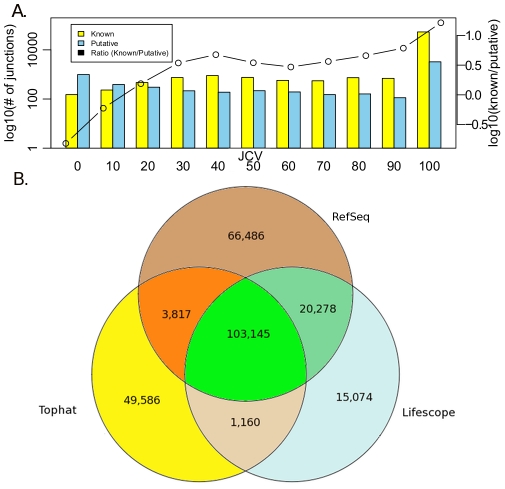
Figure 3. Improvements by junction confidence value and comparison to TopHat.
A. Logarithms of number of known and putative junctions are shown with yellow and blue bars respectively. The ratio of known over putative is shown with dashed line. Dataset consisted of 64,000 sample UHR junctions called with default thresholds. B. TopHat and Lifescope candidate calls were compared to each other and also to RefSeq database. TopHat junctions were filtered with score>5, and Lifescope junctions were filtered with 1-SR-1-PE threshold (requiring one span and one bridge evidence).

