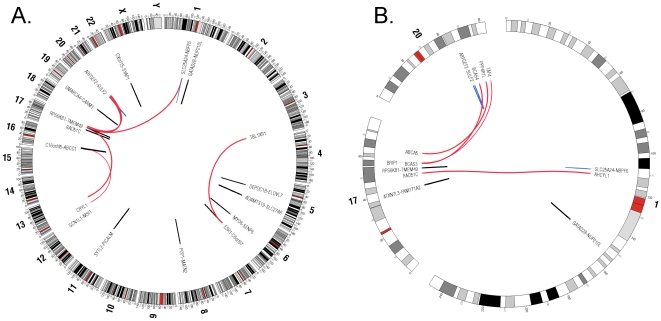
Figure 4. Localization of gene fusions on specific chromosomal regions.
A. Whole genome and B. Chr 1, 17 and 20 gene fusions circular graph. Red lines represent inter-chromosomal gene fusions, blue lines represent inverted intra-chromosomal and black lines represent same-strand intra-chromosomal fusion events. Graphs were drawn with Circos software [61].

