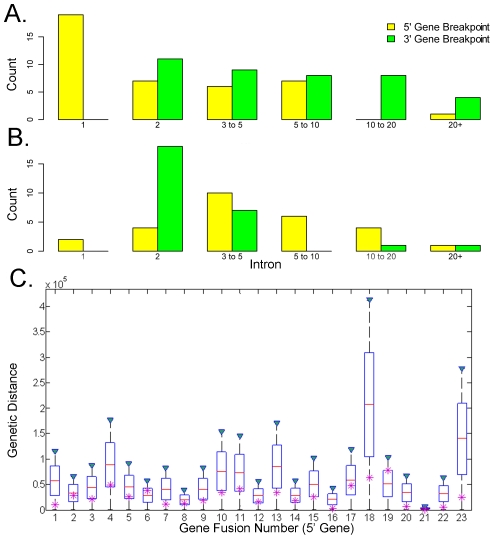
Figure 5. Fusion breakpoints are biased to 5′ end of the genes.
Histogram of order of 5′ (yellow) and 3′ (green) intron breakpoints for A. MCF-7, B. UHR and HBR combined gene fusions. Breakpoint is inferred to happen at the intron (X axis) following the exon that is fused. Y axis shows the count of breakpoints that are inferred to happen at numbered intron. C. Boxplot of the distribution of simulated gene fusion locations for each of the 23 genes in which a fusion was observed. Magenta star marks the location of the observed fusion, relative to the 5′ exon. 23 fusions correspond to the gene fusions from Table 2 (except for ESR1- C6orf97, and ADAMTS19- SLC27A6 alternatively spliced fusions merged into single data points).

